Python Memory Leak: How to Find and Fix It with Memray
Learn how to track down and fix any python memory leak using the Memray profiler to keep your containers stable and prevent production crashes.

When a backend service enters a cycle of progressive RAM consumption until it gets terminated by the virtual machine's OOM Killer, the primary suspect is a python memory leak. Unlike unmanaged languages like C or C++, where memory leaks stem from explicitly forgetting to free pointers, the problem in Python takes a more subtle form. In the Python 3.14.7 runtime, memory leaks almost always happen due to unintended reference retention within the application's object graph, which prevents the garbage collector from reclaiming memory.
When a process consumes hundreds of megabytes beyond its expected baseline, scheduling automated restarts in Kubernetes or systemd is merely a dangerous temporary band-aid. To solve the issue at its root, you need to understand the CPython memory manager architecture, isolate allocation bottlenecks with dedicated profiling tools, and refactor code patterns that block automatic garbage collection.
Why Python Process Memory Keeps Growing in Production
The CPython interpreter relies on a hybrid memory management model driven primarily by reference counting, supplemented by a cyclic garbage collector. Every Python object carries a PyObject header that stores its type and current reference count. As soon as that reference count drops to zero, CPython immediately deallocates the object's memory.
The issue arises when lingering references stay active in long-lived scopes. If an object is appended to a global list, stored in a module-level dictionary, assigned to a class attribute, or captured inside a long-running closure, its reference count will never reach zero. As a result, the interpreter assumes the underlying data remains in use and refuses to discard it.
Furthermore, CPython's internal memory allocator (pymalloc) manages small memory blocks partitioned into arenas, pools, and blocks. When Python frees an object internally, that memory often returns to pymalloc's internal pool rather than directly to the host operating system. This behavior causes physical memory fragmentation (Resident Set Size - RSS), making the process appear to hoard RAM even after completing heavy operations.
To make matters worse, native extension modules written in C, Rust, or C++ allocate memory directly on the system heap via malloc. CPython's Garbage Collector is entirely blind to these native allocations, making leaks caused by flawed native bindings or unclosed file descriptors and connection handles completely invisible to standard interpreter tools.
How to Identify a Python Memory Leak in Practice
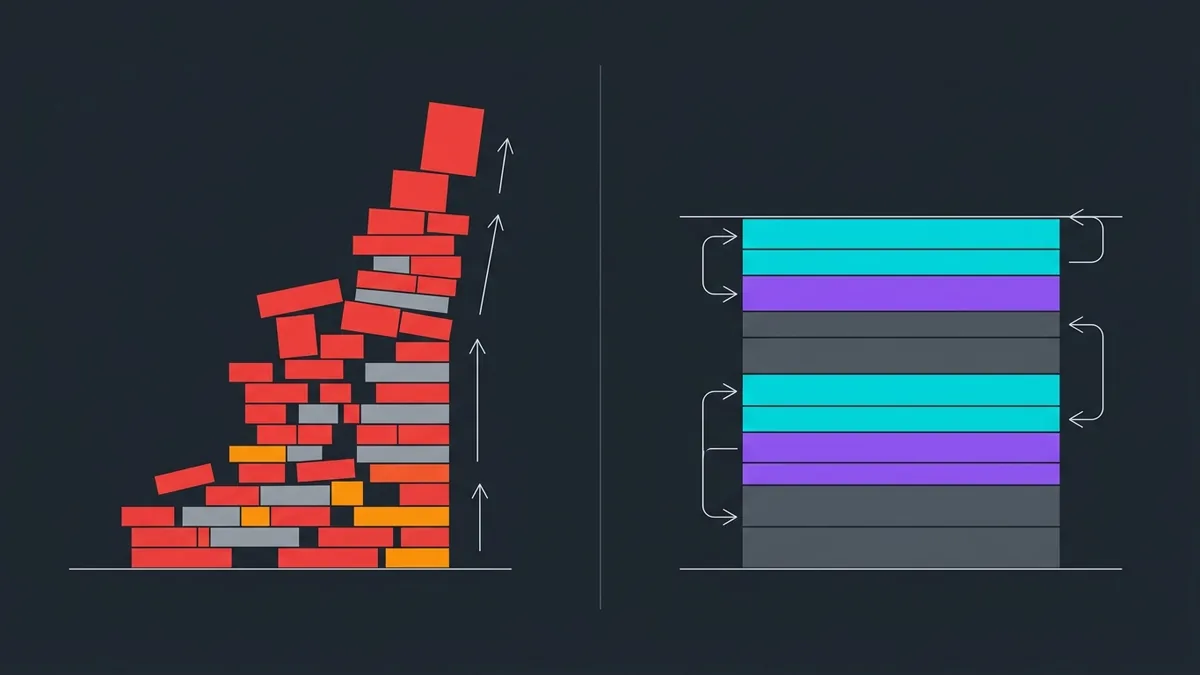
Diagnosing memory retention by inspecting source code manually is inefficient. While Python's built-in tracemalloc module helps in basic scenarios, it introduces substantial execution overhead and cannot track native allocations outside the CPython interpreter. The modern, high-precision solution for this analysis is Memray, a dedicated memory profiler designed specifically for Python applications.
Memray tracks allocations at both the Python interpreter level and within native C extensions. It records every allocation instruction with minimal runtime overhead, allowing you to run the profiler directly in staging environments or controlled production replicas.
To begin profiling, install Memray using your package manager and set up the script exhibiting continuous RAM growth:
pip install memray
Consider the example application below, which simulates a classic memory leak caused by accumulating request history inside an unbounded global list:
import time

# Simulation of an unbounded global audit log
HISTORICO_REQUISICOES = []

class PayloadProcessado:
    def __init__(self, identificador: int, dados: bytes):
        self.identificador = identificador
        self.dados = dados

def processar_requisicao(indice: int) -> None:
    # Allocates a substantial 1 MB buffer per call
    conteudo = bytes(1024 * 1024)
    payload = PayloadProcessado(identificador=indice, dados=conteudo)

    # Architectural bug: object is retained globally forever
    HISTORICO_REQUISICOES.append(payload)

def executar_servico() -> None:
    for i in range(100):
        processar_requisicao(i)
        time.sleep(0.01)

if __name__ == "__main__":
    executar_servico()
Recording the Allocation Profile with Memray CLI
To capture the complete allocation profile of your script without modifying a single line of application code, run memray run in your terminal. Include the --native flag whenever you suspect leaks in C extensions like NumPy, Pandas, or database drivers:
python -m memray run --native -o perfil_memoria.bin meu_script.py
When execution completes, Memray outputs a binary file containing the complete call tree of allocations and deallocations over time. The next step is converting this raw capture into an intuitive visualization.
Analyzing the Flamegraph to Find the Exact Line
The most effective format for interpreting Memray captures is a flamegraph. Generate the HTML report from your binary capture using the following CLI command:
python -m memray flamegraph perfil_memoria.bin -o relatorio.html
Open relatorio.html in any web browser. The interactive interface displays horizontal bars where block width corresponds to the total memory allocated by that function. By examining the top of the flame stack, you can pinpoint the exact line of code where memory was allocated and retained, letting you trace the data path directly to the bottleneck.
Common Code Patterns That Cause Unintentional Retention
Analyzing profiler reports shows that the vast majority of Python leaks stem from three recurring anti-patterns. Understanding the mechanics behind these mistakes helps prevent them during development.
| Anti-Pattern | Leak Mechanism | Production Impact |
|---|---|---|
| Unbounded Caches | Storing objects in global dicts without size caps (LRU) | Linear, unbounded RSS growth leading to process crashes |
Circular References with __del__ |
Interlinked objects block zero reference count and burden cyclic GC | Stale object accumulation in heap memory |
| Event Listeners & Callbacks | Long-lived event buses keeping strong references to instance methods | Prevents GC cleanup of entire object graphs |
The first anti-pattern is misconfiguring cache decorators. Applying @functools.lru_cache without specifying maxsize (or explicitly passing maxsize=None) caches function outputs indefinitely. If your application processes requests containing dynamic arguments (such as UUIDs or timestamps), the cache grows without bound until host RAM is exhausted.
The second pattern involves circular references across complex object graphs. This occurs when Object A holds a reference to Object B, and Object B holds a reference back to Object A. Reference counting fails here because neither object's count reaches zero naturally. While CPython's cyclic Garbage Collector targets these cycles, custom __del__ finalizers or C extension dependencies can prevent automatic cleanup.
The third pattern stems from event dispatchers and signal handlers. When a class instance registers a method as a callback on a long-lived event bus, the bus holds a strong reference to the entire instance. Even if the rest of your application drops all references to that object, the event handler keeps the instance alive in memory.
Fixing Memory Leak Patterns and Validating the Solution

To eliminate memory retention, refactor your code to enforce explicit scoping and leverage weak references. As a general rule, replace unbounded in-memory caches with bounded evicting structures or weak reference tables using the native weakref module.
If you want to keep cached instances only while they are actively referenced elsewhere in your application, use weakref.WeakValueDictionary. This structure avoids incrementing strong reference counts, allowing the Garbage Collector to reclaim objects as soon as they drop out of primary scopes:
import weakref
import gc

class ObjetoPesado:
    def __init__(self, chave: str):
        self.chave = chave
        self.dados = bytearray(10 * 1024 * 1024)  # 10 MB

class GerenciadorCacheRefatorado:
    def __init__(self):
        # WeakValueDictionary does not block garbage collection
        self._cache: weakref.WeakValueDictionary[str, ObjetoPesado] = weakref.WeakValueDictionary()

    def obter_objeto(self, chave: str) -> ObjetoPesado:
        obj = self._cache.get(chave)
        if obj is None:
            obj = ObjetoPesado(chave)
            self._cache[chave] = obj
        return obj

def testar_comportamento_memoria():
    cache = GerenciadorCacheRefatorado()

    # Created inside a temporary scope
    def escopo_temporario():
        item = cache.obter_objeto("sessao_123")
        print(f"Objeto em uso dentro do escopo. Itens no cache: {len(cache._cache)}")

    escopo_temporario()

    # Force cyclic garbage collection to verify immediate release
    gc.collect()

    print(f"Após sair do escopo local. Itens restantes no cache: {len(cache._cache)}")

if __name__ == "__main__":
    testar_comportamento_memoria()
Another critical optimization is replacing bulk sequence loading with streaming generators or iterators. Instead of fetching a massive PostgreSQL 18.6 query or reading a huge file entirely into a list, stream records in chunks using yield:
from typing import Iterator

def ler_registros_grandes(caminho_arquivo: str) -> Iterator[str]:
    """Processes multi-gigabyte files line-by-line without inflating process RSS."""
    with open(caminho_arquivo, mode="r", encoding="utf-8") as arquivo:
        for linha in arquivo:
            # Yields individual lines without loading the whole file into RAM
            yield linha.strip()

def processar_pipeline(caminho: str) -> None:
    for registro in ler_registros_grandes(caminho):
        # Direct processing on individual items
        pass
Finally, to verify your fix, run Memray to inspect allocation stats. Compare your original execution profile against the refactored implementation:
python -m memray run -o perfil_antigo.bin versao_antiga.py
python -m memray run -o perfil_novo.bin versao_nova.py
python -m memray stats perfil_novo.bin
The stats command prints total allocation counts, peak memory usage, and total bytes allocated. A successful refactoring will show heap usage flattening into a stable plateau over time rather than climbing continuously.
Conclusion
Understanding memory dynamics and profiling runtime allocations are essential skills for maintaining resilient, scalable Python services in production. By learning how reference counting and native heap allocations interact with the operating system, you can shift from reactive container restarts to definitive root-cause fixes.
Modern tools like Memray turn complex memory analysis into a deterministic process, pinpointing the exact lines responsible for holding onto dead data. Integrating these profiling steps into your CI/CD pipeline is the definitive way to eliminate any python memory leak from your production environment.